Azure Network Watcher
Another tool an IT auditor can leverage is Azure Network Watcher. Azure Network Watcher is designed to monitor and repair the network health of infrastructure as a service (IaaS ) products, which include virtual machines, virtual networks, application gateways, load balancers, and so on. To launch Azure Network Watcher, you can easily search for it in a browser or on the Azure console, as seen in Figure 7.20:
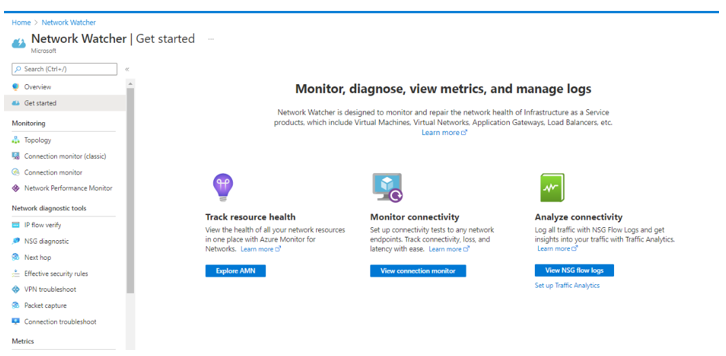
Figure 7.20 – Azure Network Watcher
One feature of interest to an IT auditor is the Effective security rules tab. For our example, let us navigate to the Effective security rules tab as shown in Figure 7.21:
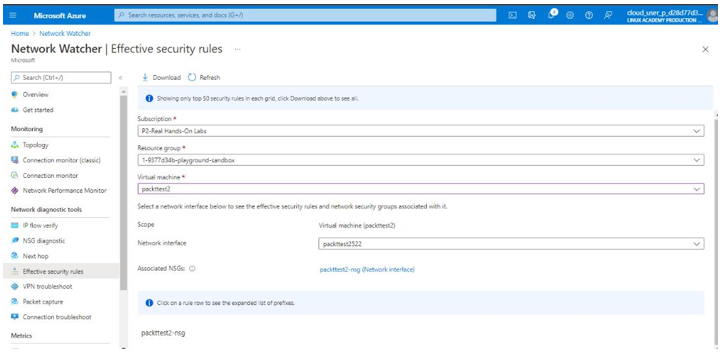
Figure 7.21 – Effective security rules
We will then click on the packttest2-nsg rule to expand it and review the individual rules, as seen in Figure 7.22. As we can see, we have two exclamation marks on two inbound rules that would be ofextreme interest to an IT auditor. Examining these rules closely, we will find that SSH and RDP access is not restricted inbound from the internet. If you can recall from Chapter 4, Network, Infrastructure, and Security Controls, we noted that the Azure CIS Benchmarks recommend that any Network Security Groups (NSG) should not allow unrestricted inbound access to remote server administration ports,such as SSH to port 22 and RDP to port 3389. This is because attackers can use various brute-force techniques to gain access to Azure Virtual Machines using remote server administration ports, such as 22 and 3389.
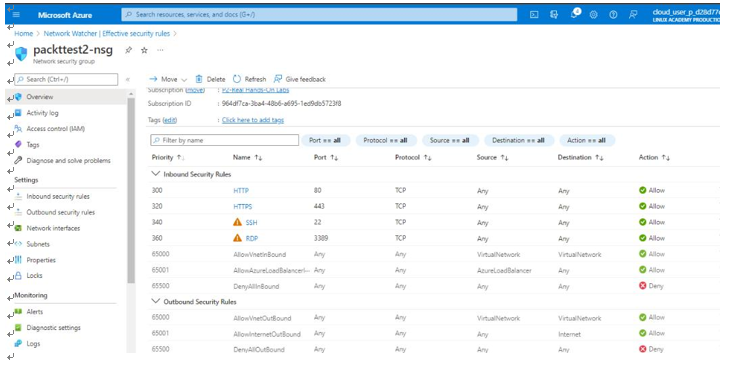
Figure 7.22 – packttest2-nsg
Next, we will look at tools in GCP.
GCP
Lastly, we will look at cloud auditing tools that can be leveraged within GCP.
Google Cloud Monitoring
IT auditors can leverage Google Cloud Monitoring to gain real-time visibility into GCP. We can get to Cloud Monitoring by simply searching for it on the Google Cloud console, as shown in Figure 7.23:

Figure 7.23 – Google Cloud Monitoring Overview
A useful feature for an IT auditor is Dashboards. This provides us with dashboards forDisks, Firewalls, Infrastructure Summary, and VM Instances:
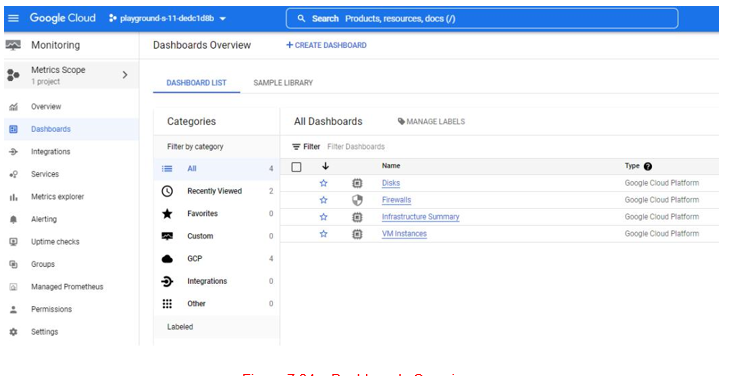
Figure 7.24 – Dashboards Overview
One valuable dashboard to review is Firewalls. Let us go to the Firewalls dashboard, as seen in Figure 7.25:
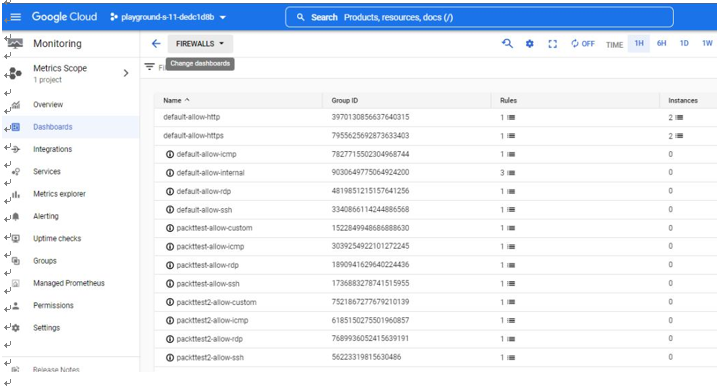
Figure 7.25 – The Firewalls dashboard
If we dig deeper, we note that there is an ingress/inbound rule that allows traffic from the internet (0.0.0.0/0). This particular rule should pique an IT auditor’s interest as port 22 (SSH) is a networkprotocol that has system administrator capabilities.
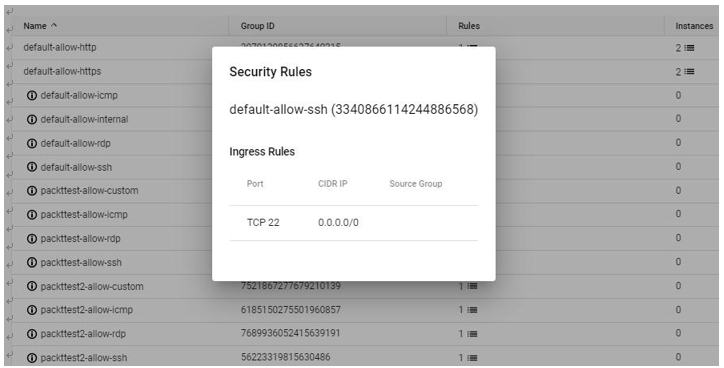
Figure 7.26 – Security Rules
Another useful feature of Google Cloud Monitoring is Alerting. The Alerting feature can allow you to trigger an alert based on a predefined metric. The Alerting dashboard can be seen in Figure 7.27:
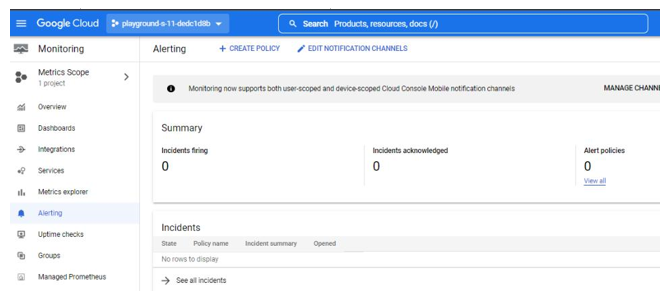
Figure 7.27 – Alerts
As an example, we can add a metric such as Audited Resource, as seen in Figure 7.28:
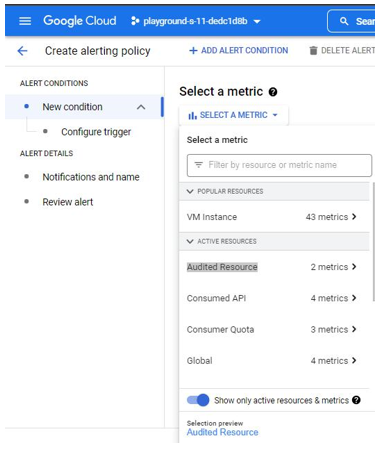
Figure 7.28 – Selecting a metric
Next, we will look at another tool in GCP referred to as Network Intelligence Center.